Assumptions From Files
It is possible to read assumtion table from Excel files int PyProtolinc, this can be done both programmatically or by configuration. in both cases the assumptions need to be stored in xlsx files in a certain format.
Programmatic Reading of Assumption Files
This example uses an excel file with the following tabs: 
[1]:
from pyprotolinc.assumptions.iohelpers import WorkbookTableReader

assumptions_file = "simple_base_assumption.xlsx"

sheet_lapse_const = "LAPSE_CONST"
sheet_lapse_1d = "LAPSE_1D"
sheet_mort_2d = "MORTALITY_2D"
#sheet_mort_3d = "_MORTALITY_2D"

with WorkbookTableReader(assumptions_file) as file:
    tab_lapse_const = file.read_sheet(sheet_lapse_const)
    tab_lapse_1d = file.read_sheet(sheet_lapse_1d)
    tab_mort_2d = file.read_sheet(sheet_mort_2d)

    prvdr_lapse_const = tab_lapse_const.rates_provider()
    prvdr_lapse_1d = tab_lapse_1d.rates_provider()
    prvdr_mort_2d = tab_mort_2d.rates_provider()

prvdr_lapse_const, prvdr_lapse_1d, prvdr_mort_2d
[1]:
(<CConstantRateProvider with constant 0.200000>,
 <CStandardRateProvider with RF (CalendarYear)>,
 <CStandardRateProvider with RF (Age, Gender)>)
As we can see we have created three providers with different configurations based on the data in the worksheets.
Let’s have a look at the contents of the file:
0D (tab “LAPSE_CONST”) |
1D (tab “LAPSE_1D”) |
2D (tab “MORTALITY_2D”) |
|---|---|---|
|
|
|
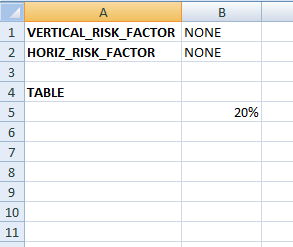
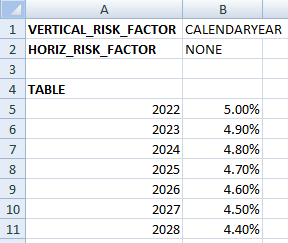
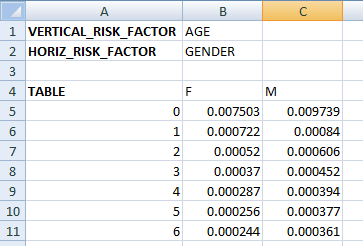
Each tab starts with a header listing the vertical and horizontal risk factor names (or “NONE”) and then a TABLE section. When using a 0D example we expect only one value and this is translated to a ConstantRateProvider while 1D and 2D will trigger the creation of a StandardRateProvider. Please also note that the offsets are extracted as well.
[2]:
import numpy as np
from pyprotolinc.models.risk_factors import Gender

calendaryear = np.array([2024, 2023])
prvdr_lapse_1d.get_rates(2, calendaryear=calendaryear)
[2]:
array([0.048, 0.049])
[3]:
# lookup 3-year old male and 6 year old female
age = np.array([3, 6])
gender = np.array([Gender.M, Gender.F])
prvdr_mort_2d.get_rates(2, age=age, gender=gender)
[3]:
array([0.000452, 0.000244])